4. Results
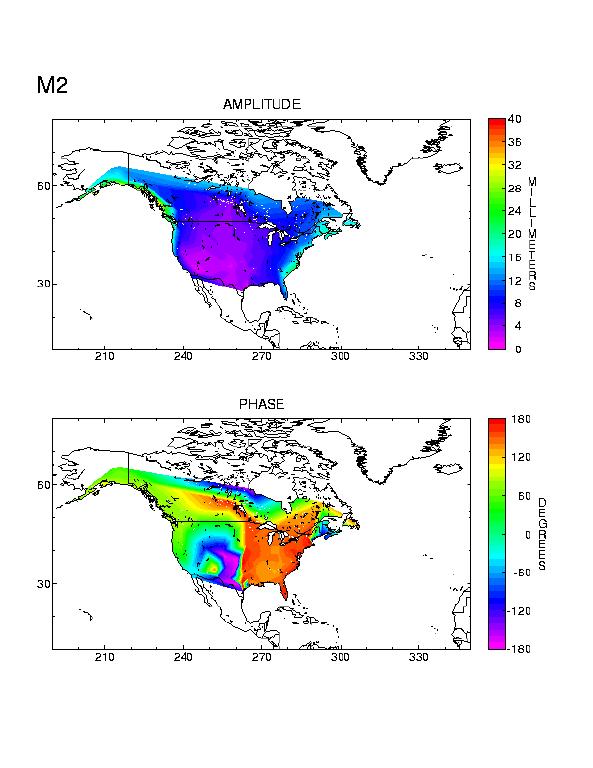
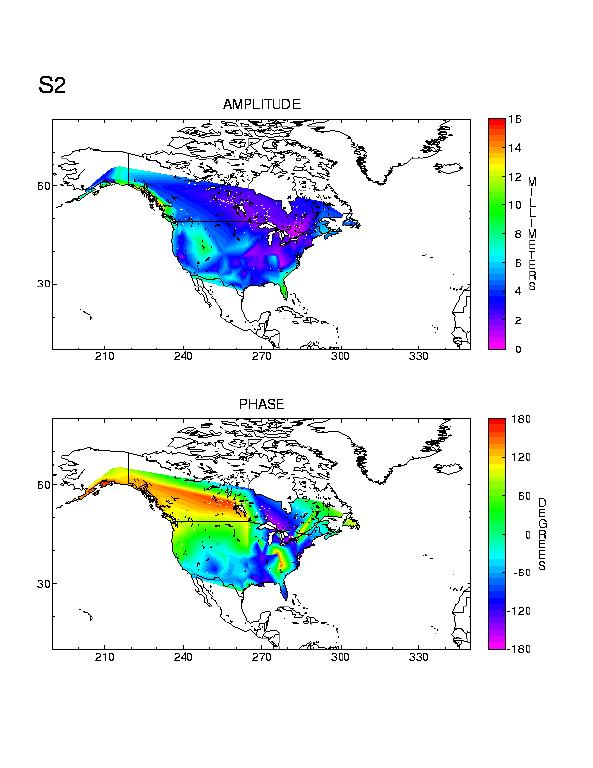
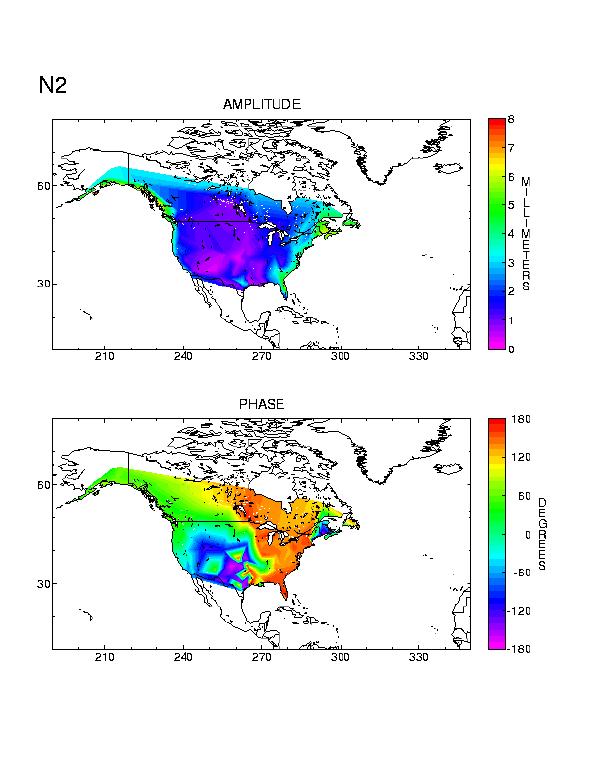
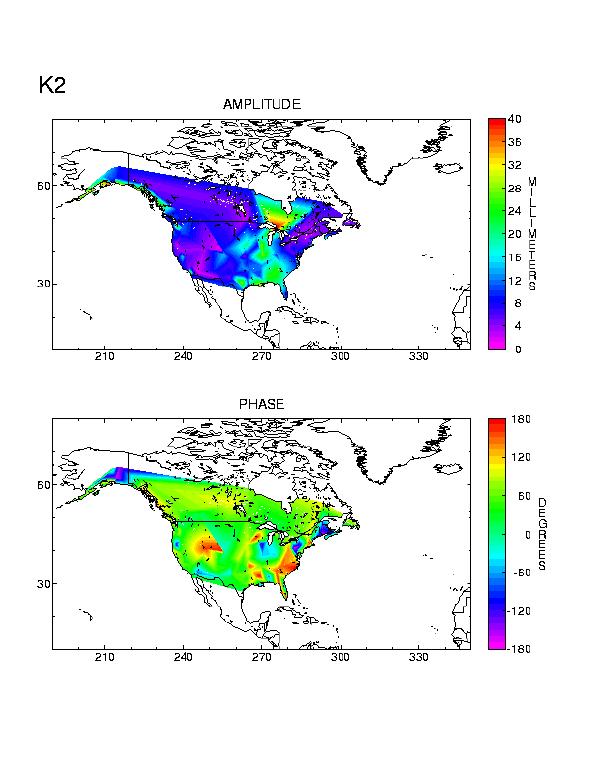
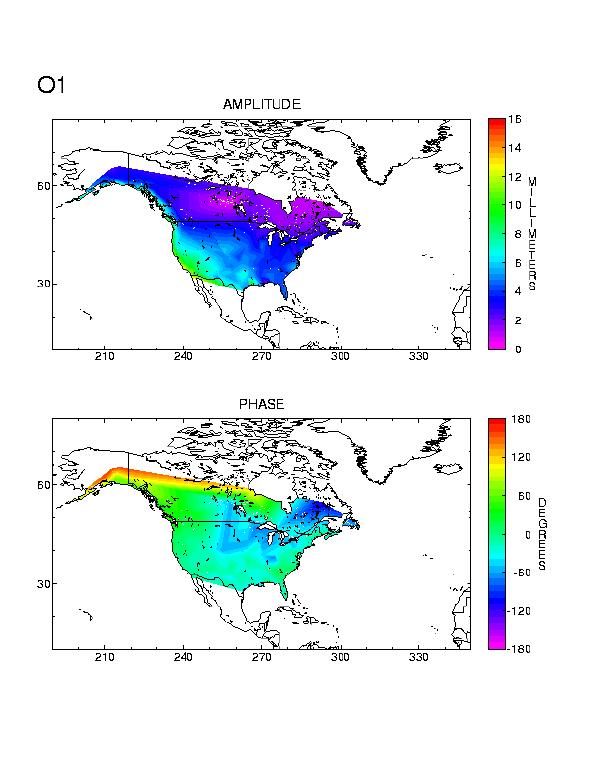
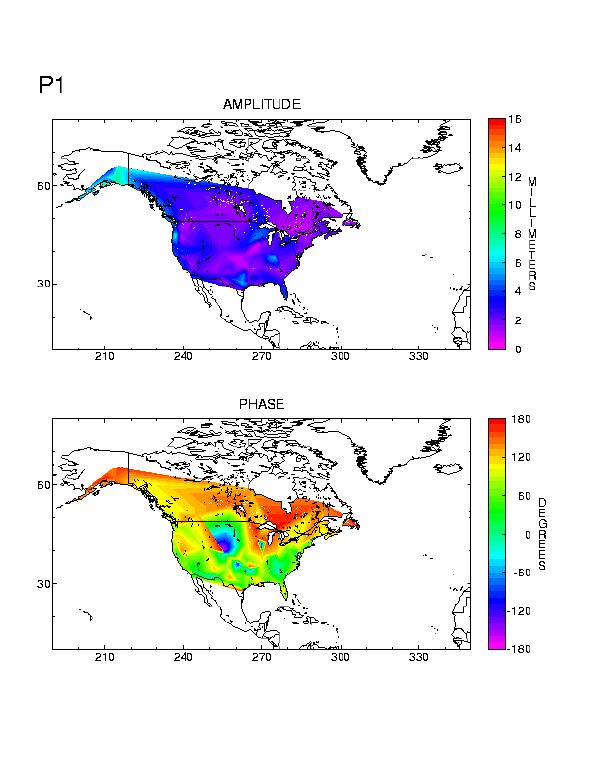
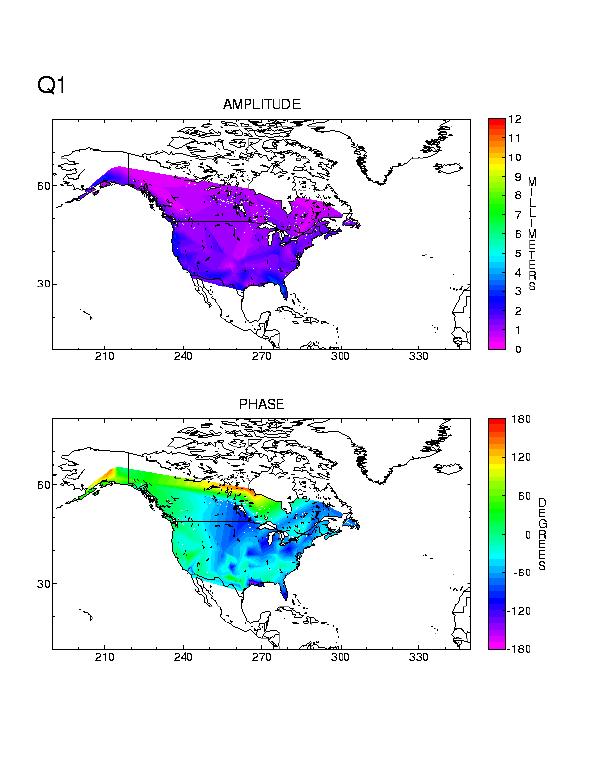
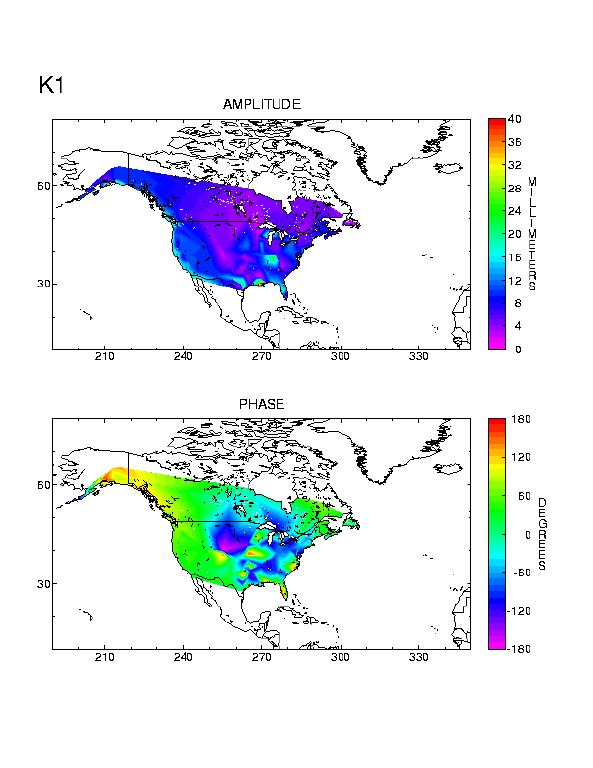
The eleven tidal signals included in this processing are listed in the associated table. The three long-period tidal signals, Mf, Mm, and Ssa, will not be discussed here. All amplitudes are in millimeters. The phases are relative to the potential generating the associated solid earth tide at the zero meridian, and are in degrees. This is consistent with those described in the International Earth Rotation Service standards [McCarthy, 1992].
| Tidal Harmonics Included in this Project | ||
| Darwin Symbol | Name | Period |
| Semidiurnal | ||
| M2 | Principal lunar | 12.42 h |
| S2 | Principal solar | 12.00 h |
| N2 | Major lunar elliptical | 12.66 h |
| K2 | Luni-solar declinational | 11.97 h |
| Diurnal | ||
| O1 | Principal lunar | 25.82 h |
| P1 | Principal solar | 24.07 h |
| Q1 | Major lunar elliptical | 26.87 h |
| K1 | Luni-solar declinational | 23.93 h |
| Long-period | ||
| Mf | Lunar fortnightly | 13.66 d |
| Mm | Lunar monthly | 27.55 d |
| Ssa | Solar semiannual | 182.62 d |
| h = hours; d = days | ||
Monte carlo simulations of phase noise and white station noise, and tests wherein the data were subdivided into three subsets with the same total time span (subset 1 = day-of-year 001, 004, 007, ..., 361, 364; subset 2 = 002, 005, 008, ..., 362, 365; and subset 3 = 003, 006, 009, ..., 360, 363) indicate that, internally, these amplitudes have an uncertainties at the millimeter level. The phase uncertainties have a dependence upon the amplitude. Typically, uncertainties in the phase are a few degrees; however, signals with very small amplitudes will have uncertainties of tens of degrees.
4.1 Overview
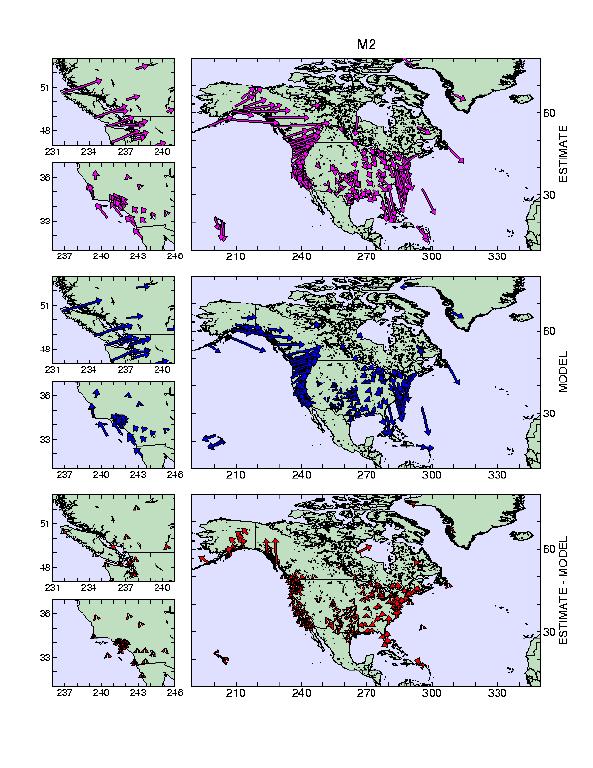
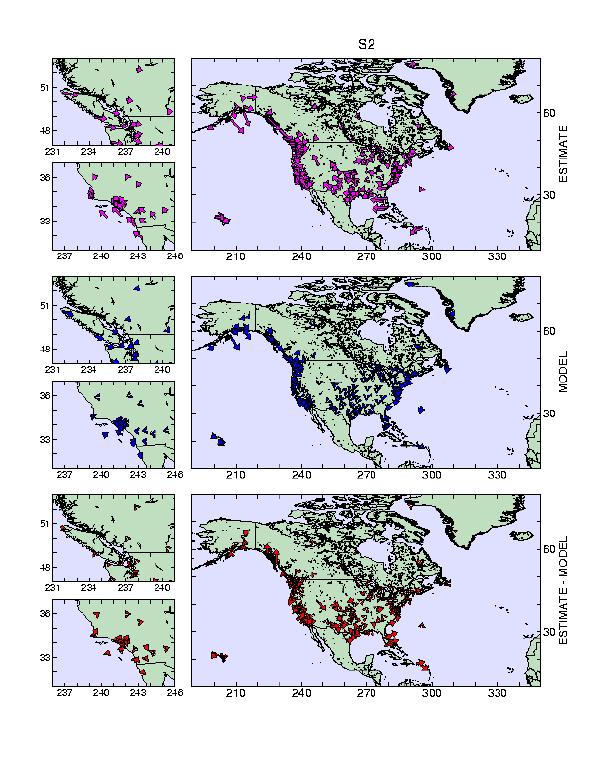
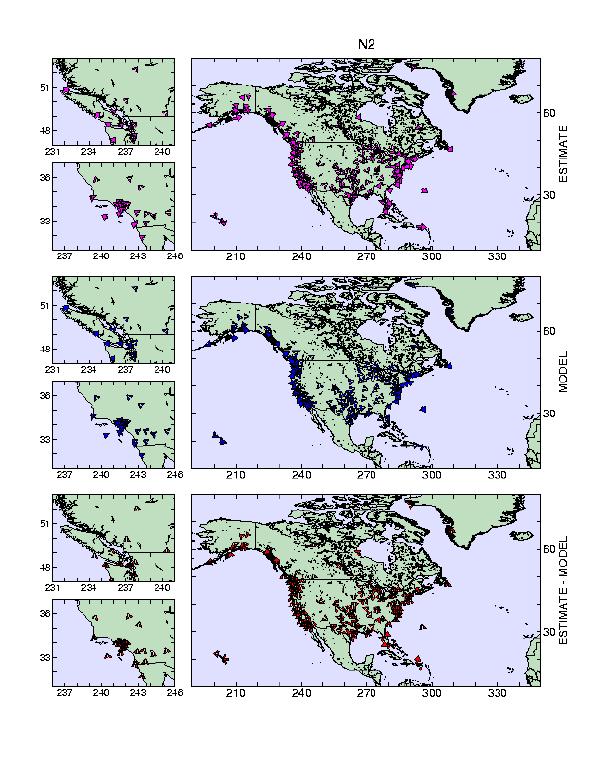
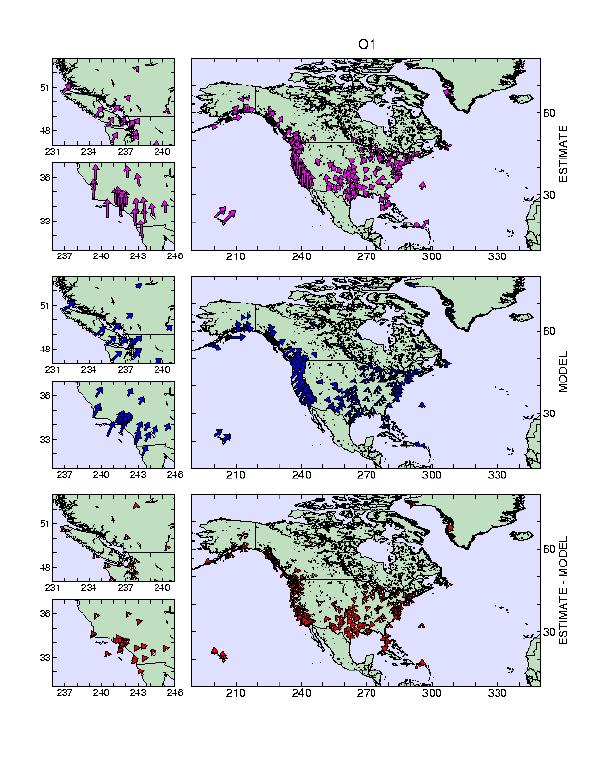
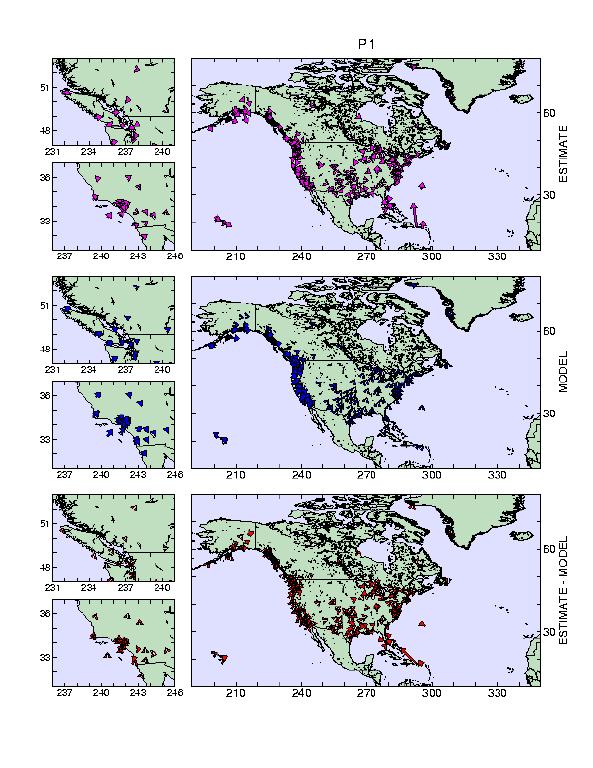
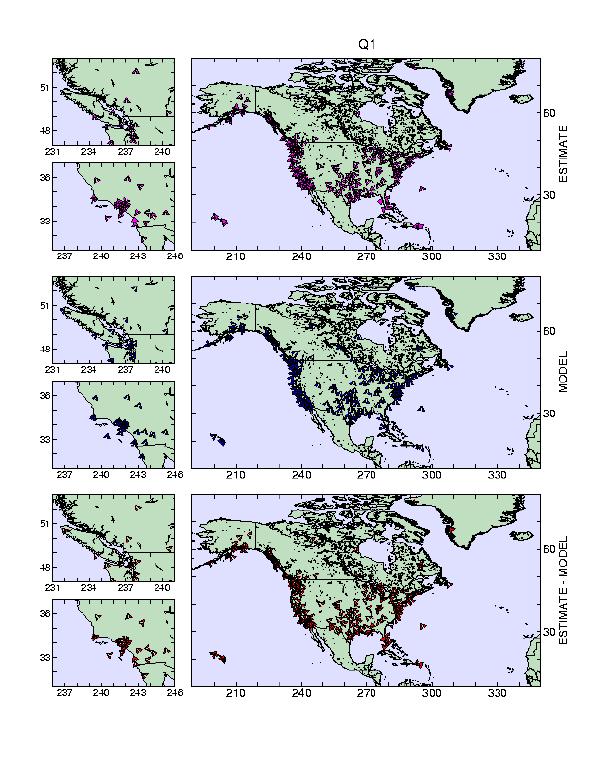
The results from six of the tidal harmonics: M2, S2, N2, O1, P1, and Q1 are excellent. The general characteristics: the amplitude and relative strength of the signal within a region are as expected. The results are shows in the associated figures.
| Contour plots (JPEG) | Caption | M2 | S2 | N2 | K2 | O1 | P1 | Q1 | K1 | ||||||||||||||||||||
| Contour plots (PostScript) | Caption | M2 | S2 | N2 | K2 | O1 | P1 | Q1 | K1 | ||||||||||||||||||||
| Summary plots (JPEG) | Caption | M2 | S2 | N2 | K2 | O1 | P1 | Q1 | K1 | ||||||||||||||||||||
| Summary plots (PostScript) | Caption | M2 | S2 | N2 | K2 | O1 | P1 | Q1 | K1 |
4.2 Problems with site MIA1/MIA3
One site, MIA1/MIA3, was consistently an outlier in position, velocity, and tidal terms. The reason for this performance is not known at this time. This site was available for only four months, 138 days to be exact. Although a possible source of this problem, a few other sites were available for shorter time spans, and do not show this poor performance. Although this site was retained in the processing which generated these results, further discussion of MIA1/MIA3 will be omitted pending further investigation.
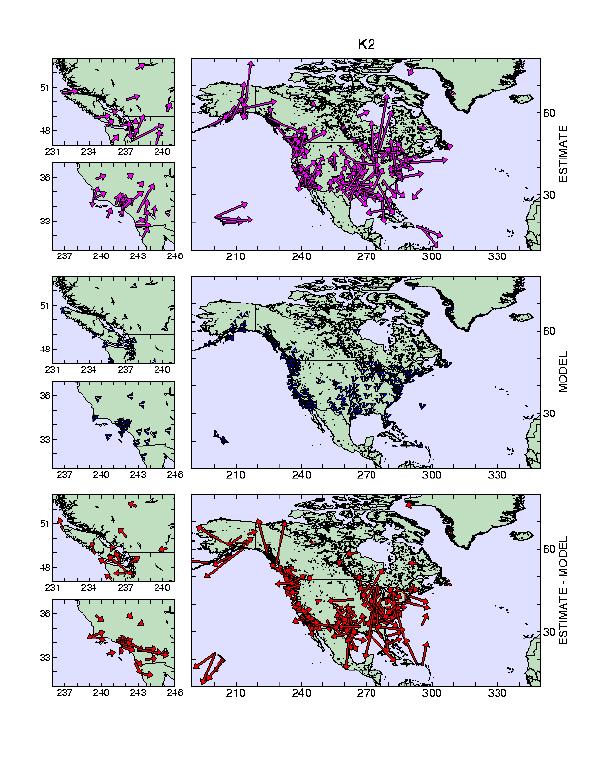
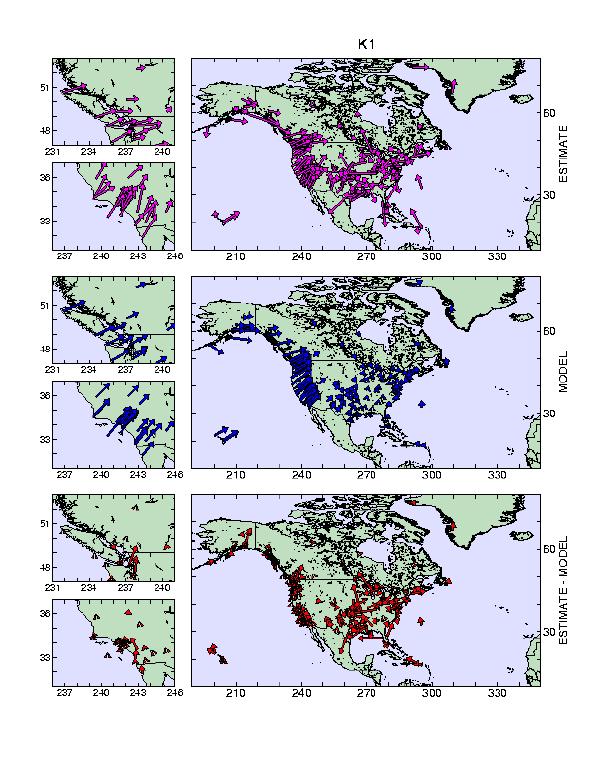
4.3 Problems with the K1 and K2 tidal parameters
Two tidal harmonics, the K2 and, to a lesser degree, K1 harmonics yield poor results. Although the K1 results display reasonable behavior and good agreement with current models overall, several sites have unreasonably large amplitude signals. The results are even worse for the K2 parameters. No explanation for this behavior has been proven; however, one of the authors (MSS) has suggested the following hypothesis. The K2 tide's period is close to one-half a sidereal day, and therefore, is close to the orbital period of the GPS satellites. The K1 is, of course, twice this period. It was suggested that any remaining processing errors: cycle slips, errors in estimating tropospheric or phase ambiguity parameters, or genuine orbit errors could be aliasing into the K2, and, to a lesser extent, the K1 tidal parameters. This hypothesis is currently under investigation.
4.4 Comparison to the Schwiderski global model integrated with the Canadian regional model [Lambert et al., 1998]
| ALBH | MODEL | GPS | ||
|---|---|---|---|---|
| Tide | AMP (mm) | PHASE (deg) | AMP (mm) | PHASE (deg) |
| M2 | 14.6 | 81.7 | 14.2 | 84.0 |
| S2 | 4.6 | 127.4 | 5.7 | 103.9 |
| N2 | 2.5 | 50.3 | 3.0 | 50.2 |
| K2 | 1.0 | 111.1 | 9.3 | 82.2 |
| O1 | 9.2 | 53.5 | 7.6 | 37.4 |
| P1 | 3.7 | 60.2 | 4.6 | 96.5 |
| Q1 | 1.4 | 40.3 | 1.9 | 8.8 |
| K1 | 14.6 | 69.6 | 13.2 | 73.8 |
| CHUR | MODEL | GPS | ||
|---|---|---|---|---|
| Tide | AMP (mm) | PHASE (deg) | AMP (mm) | PHASE (deg) |
| M2 | 8.0 | 183.7 | 15.1 | 187.6 |
| S2 | 2.2 | 254.8 | 2.5 | 269.7 |
| N2 | 1.8 | 165.4 | 3.2 | 145.9 |
| K2 | 0.4 | 166.6 | 9.0 | 65.8 |
| O1 | 1.8 | 27.5 | 1.6 | 120.4 |
| P1 | 0.9 | 30.5 | 2.9 | 129.5 |
| Q1 | 0.4 | 19.6 | 0.8 | 158.0 |
| K1 | 2.3 | 46.5 | 3.9 | 350.0 |
| CAGS* | MODEL | GPS | ||
|---|---|---|---|---|
| Tide | AMP (mm) | PHASE (deg) | AMP (mm) | PHASE (deg) |
| M2 | 5.7 | 154.7 | 10.9 | 147.1 |
| S2 | 1.8 | 187.9 | 0.5 | 119.8 |
| N2 | 1.0 | 136.5 | 3.1 | 139.5 |
| K2 | 0.6 | 185.6 | 3.2 | 52.2 |
| O1 | 1.7 | 348.5 | 1.9 | 324.3 |
| P1 | 1.0 | 358.1 | 1.0 | 96.4 |
| Q1 | 0.4 | 2.8 | 0.4 | 339.8 |
| K1 | 2.9 | 358.3 | 3.1 | 10.5 |
| HOLB | MODEL | GPS | ||
|---|---|---|---|---|
| Tide | AMP (mm) | PHASE (deg) | AMP (mm) | PHASE (deg) |
| M2 | 30.2 | 76.6 | 29.9 | 72.2 |
| S2 | 9.3 | 116.5 | 11.2 | 102.8 |
| N2 | 5.7 | 49.4 | 6.3 | 45.9 |
| K2 | 2.2 | 105.8 | 11.0 | 81.2 |
| O1 | 11.1 | 54.2 | 8.6 | 41.8 |
| P1 | 5.5 | 66.2 | 5.2 | 91.8 |
| Q1 | 2.1 | 46.6 | 1.7 | 1.3 |
| K1 | 17.5 | 68.1 | 17.9 | 71.7 |
| WES2 | MODEL | GPS | ||
|---|---|---|---|---|
| Tide | AMP (mm) | PHASE (deg) | AMP (mm) | PHASE (deg) |
| M2 | 8.5 | 194.2 | 13.4 | 173.9 |
| S2 | 2.4 | 215.8 | 0.9 | 216.3 |
| N2 | 1.9 | 179.0 | 3.5 | 156.2 |
| K2 | 0.8 | 202.2 | 3.9 | 169.8 |
| O1 | 2.5 | 351.1 | 2.8 | 341.4 |
| P1 | 1.3 | 356.1 | 1.4 | 42.4 |
| Q1 | 0.6 | 359.8 | 1.1 | 315.7 |
| K1 | 3.9 | 355.4 | 4.4 | 350.2 |