The National Oceanic and Atmospheric Administration (NOAA), National Geodetic Survey (NGS) has collaborated with the Federal Aviation Administration (FAA) AVN, the University of Florida Geomatics Department, and Optech Inc. to test the feasibility of using an Optech 33 kHz Airborne Laser Terrain Mapper (ALTM) for FAA programs (AVN-Flight Check / NACO-Flight Edit) and NGS Aeronautical Survey Program (ASP).
The objectives of the project were:
To evaluate the ability of this system
to meet FAA
405 obstruction accuracy requirements and other standards.
To test the system in a pressurized aircraft
using higher operating speeds for data acquisition.
To perform a horizontal and vertical accuracy
assessment of the ALTM data using ground control points collected by NGS
and the University of Florida. This assessment will evaluate the use of
LIDAR to support the Aeronautical Survey process.
To determine whether the ALTM will detect
the top of a structure, even if it is a fairly thin object (e.g., a small
whip antenna).
To collect data for a possible future
cost/benefit analysis. This includes determination of the cost and
time for collecting and processing the LIDAR data.
Evaluation of the ability to classify
feature types using the ALTM system.
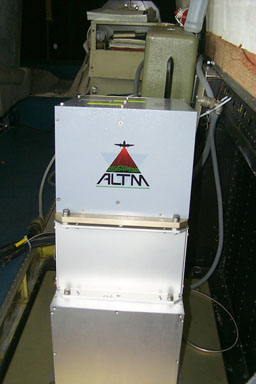
In February of 2001 an Optech 33kHz ALTM
was mounted onboard the NOAA Cessna
Citation for a LIDAR demonstration at Gainesville Regional Airport,
Gainesville, Florida. LIDAR data were collected at two different altitudes
(700 meters agl and 1200 meters agl) over two days and post-processed by
Optech Inc. The entire survey was processed using Optech's proprietary
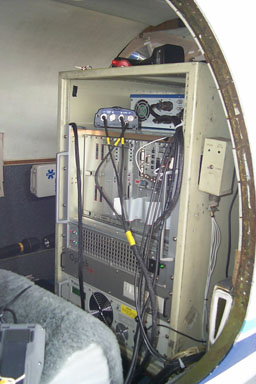
software "REALM Survey Suite, Version 3.0g". This includes GPS processing,
POS Processing (integrated "POSProc" software developed by Applanix, manufacturer's
of the Position and Orientation System used in Optech's ALTMs), and Laser
Point processing.
The final processed data was outputted
in strips, represented by both time, and flight strips.
Both airborne and ground-based GPS data
were collected at a one-second rate. The ground data was collected
using a Trimble GPS receiver, whereas the airborne data was collected using
a Novatel GPS receiver.
| Optech ALTM mounted in the NOAA Cessna
Citation
|
|
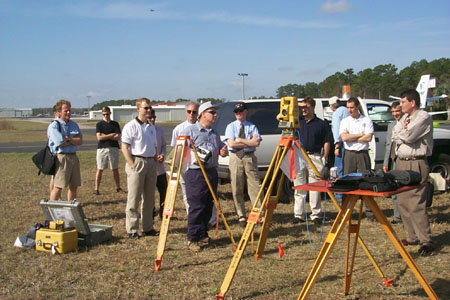
In order to evaluate the LIDAR data several field teams were deployed
from both NGS and the University of Florida to collect ground control.
Over 100,000 GPS points were collected using roving kinematic GPS techniques.
Obstructions
(antennae, telephone poles, etc.) were surveyed using traditional means.
Surveys were conducted during the same week as the airborne data collection.
| Kinematic GPS Surveys
|
Obstruction Surveys
|
Preliminary analysis has started and results will be posted as they become available.
The images below are a small subset of the LIDAR data covering an area north of the runway at Gainesville Regional Airport. These images are bins constructed by the NGS Remote Sensing division depicting the max LIDAR elevation measured within 1 and 2 meter groundels. Each pixel in the image represents 1 or 2 square meters on the ground. The black pixels represent groundels with no LIDAR measurement. This provides a detailed view of the raw LIDAR data without interpolation and illustrates the necessity for careful interpretation of LIDAR data for use in airport obstruction charting.
Preliminary data views - Click images to view
full resolution
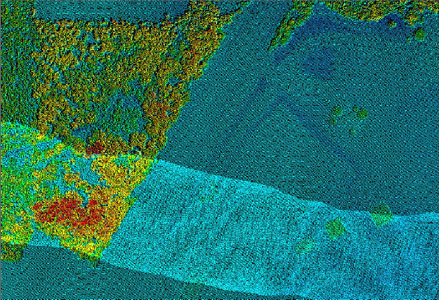
1 meter bin of LIDAR at Gainesville Regional Airport (1200m agl) |
2 meter bin of LIDAR at Gainesville Regional Airport (1200m agl) |
1 meter bin of LIDAR (700m agl) at Gainesville Regional Airport |
2 meter bin of LIDAR (700m agl) at Gainesville Regional Airport |
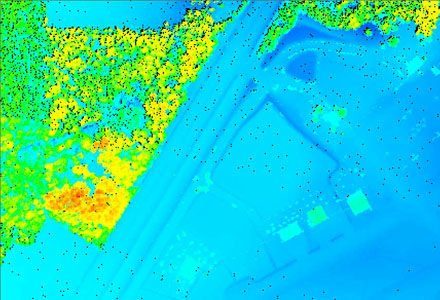
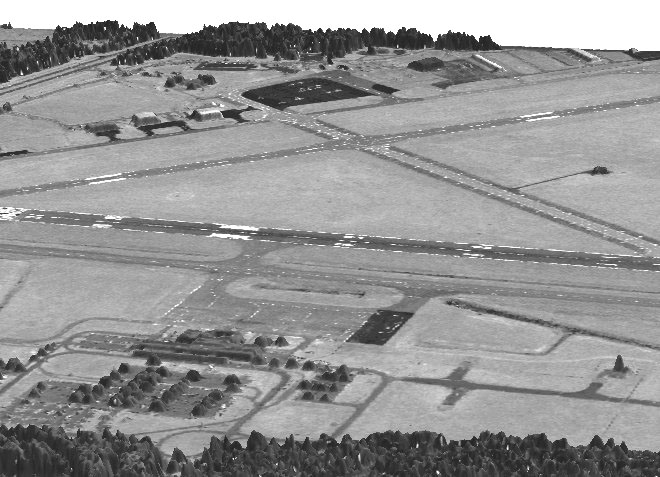
The image below was constructed using an off-the-shelf software pakage.
A 1 meter TIN was built using the 1200m agl LIDAR data. The associated
intensity data was also interpolated and draped over the TIN. The result
is a perspective view of the airfield.
 |