Web Map Application Instructions
Click the blue feature labels for more information about each tool.
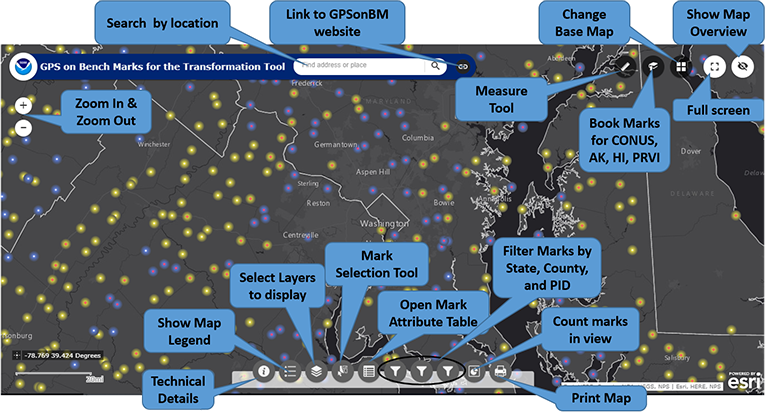
Using the GPSonBM Map
Left click and drag the map to pan to new areas. In addition to the Zoom buttons on the top left side of the map, the scroll wheel on the mouse may be used to zoom in and out on the map. There are also several options (described below) for searching the map for specific locations or marks. Two types of layers can be viewed on the map:
- Marks from the priority list
- Hexagons that indicate where data is requested for the Transformation Tool
Both the marks and hexagon are further divided into separate layers for 10 km and 2 km spacing as well as layers that show the marks and hexagons that are done. The various layers can be viewed by selecting them with the layers tool as described below.
Map features are described below, starting with features at the top left of the screen and proceeding to the right across the top and then to bottom of the screen, again from left to right.
Zoom In and Zoom Out Buttons
Change the extent of the area that can be seen on the map. If no marks display on the map, try zooming in.
Search by Location
Enter an address or place name and hit enter to zoom map to place of interest.

Link to GPSonBM Website
Click the link icon and then click on the text “NGS GPS on Bench Marks Website” to open the website in a new browser window.
Measurement Tool
Use this tool to measure areas or distances on the map, or get coordinates for any spot on the map. Click on the icon, select tool desired and then use the mouse to left-click on the points to measure.

Bookmarks
Provides quick access to specific regions. Clicking on a region will pan the map to that area. You may need to zoom in for the marks to display an othe map. To add your own bookmarks during your current browsing session, zoom into your area of interest, click the Add button and enter a name for your spot. These custom bookmarks will disappear when you reload the map.
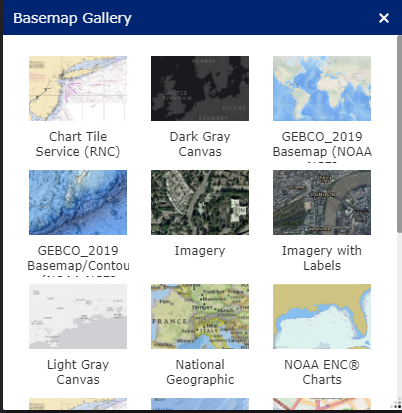
Change Basemap
This button opens the Basemap Gallery and allows user to select another basemap to replace the default Dark Gray Canvas.
Full Screen
Switches map to full screen mode, removes the browser tabs and address bar. Click the icon again or hit the Esc key to return to browser window.
Map Overview
Shows and Hides the Map Overview window which displays the broader area that the main map is zoomed into.
About Button
Provides technical details about how and why marks on the priority list were selected and provides an email link to contact the GPSonBM team: ngs.gpsonbm@noaa.gov
Legend
Clicking this button will display the legend for all of the active layers displayed on the map.
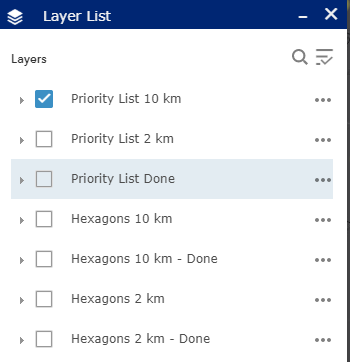
Layer List
Clicking this button will bring up the list of available layers to display on the map. By default, only the Priority List of marks at 10 km spacing appears. Users can select other layers to display on the map by clicking on the box to the left of the layer name. Once clicked, the box will show a check mark, and all layers with check marks are displayed on the map.
Layer Descriptions:
- Priority List 10 km - Marks requested for national coverage
- Priority List 2 km - Marks requested to densify local areas
- Priority List Done - All marks with enough observations to be considered for use in the Transformation Tool.
- Hexagons 10 km - Areas where GPSonBM data is still requested to complete broad national coverage
- Hexagons 10 km - Done - Areas where sufficient data exists
- Hexagons 2 km -Areas where GPSonBM data may still be submitted to increase local accuracy of the transformation tool.
- Hexagons 2 km - Done - Areas where sufficient data exists.
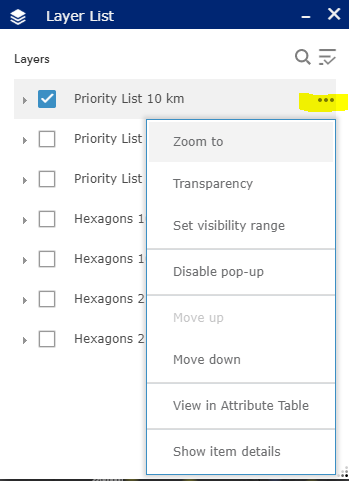
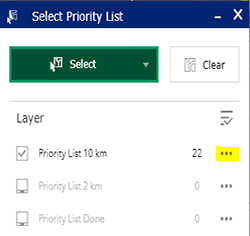
Working with the Layer List
Clicking on the ellipsis to the right of each layer opens a window with actions for that layer. Set visibility range allows the user to set the zoom level at which each layer appears. By default the visibility ranges are set to prevent too much data from being plotted at once which would slow down the application. Users with fast internet connections can change the visibility range to allow data to be displayed when zoomed out far enough to see the extents of larger states.
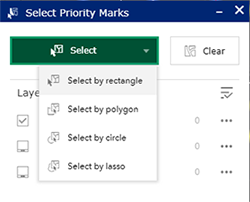
Mark Selection Tool:
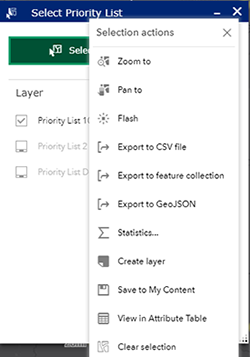 This tool provides several options for selecting marks. First, change the layer to select from, click in the box to the left of the layer name. Click the green Select box and choose a selection method, then use the mouse to left-click on the map to draw the selection region. Selected marks’ icons will turn blue. Once marks are selected, click on the ellipsis to the right of the layer to open menu of actions that can be performed with selected marks. Using this menu, selected marks can be exported into csv, JSON, and GeoJSON formats.
Attribute Table
This button opens a table at the bottom of the screen that displays all the information available on each mark.
Filters
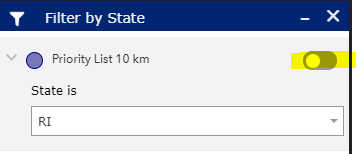 By State, County, and PID This tool allows the user to filter the marks on the map down to specific states, counties, or PIDS. After selecting the filter option, click on the switch at the top right of the filter box and the map will pan and zoom to the selected area. If the marks do not appear on the map, try zooming in until they appear.
Mark Count Tool
This tool simply provides a count of the number of priority marks in the current view.
Allows user to print the map on a printer or save as a .pdf file.

