A Free-Fall Determination of
the Newtonian Constant
of Gravity
Joshua P. Schwarz, Douglas S. Robertson
Timothy M. Niebauer, James E. Faller
[ Published in Science, 282, 2230-2234, 1998. ]
Recent determinations of the Newtonian constant of gravity have produced values that differ by nearly 40 times their individual error estimates (more than 0.5%). In an attempt to help resolve this situation, an experiment that uses the gravity field of a one-half metric ton source mass to perturb the trajectory of a free-falling mass and laser interferometry to track the falling object was performed. This experiment is the only laboratory determination of gravity that does not suspend the test mass from a support system. It is therefore free of many systematic errors associated with supports. The measured value of G was (6.6873 + 0.0094) x 10-11 m3 kg-1 sec-2.
Here we report a method for determining the Newtonian gravitational constant, G, by measuring the perturbation of the acceleration of a free-falling object due to a well-known source mass. A precise knowledge of G is of considerable metrological interest, for it provides a unique, as well as valuable, measurement challenge; one that sharpens and prepares experimental skills to better deal with a variety of precision and null measurements. Yet, despite two centuries of experimental effort, the value of G remains poorly known; recent determinations of G differ by as much as 40 times their individual estimates of uncertainty, suggesting the presence of significant systematic errors. The difficulty in measuring G stems in part from the extreme weakness of the gravitational force and the consequent difficulty of eliminating spurious forces due to such things as electromagnetic fields and thermal gradients.
In 1798 Henry Cavendish performed the first experiment specifically designed to investigate the gravitational attraction between small masses using a torsion balance to match the tiny gravitational force produced by local source masses against the restoring torque of a fiber support. This was the first laboratory measurement of this elusive fundamental constant. In the 1930s Heyl reintroduced the ``time-of-swing'' measurement, in which source masses modulate the oscillation frequency of a torsion pendulum. Both types of torsion methods introduce experimental difficulties that center on the need to precisely calibrate the restoring force. Indeed, the subtle properties of torsion fibers are still being investigated (1-3).
In 1982 Luther and Towler (4) used the time-of-swing method to achieve a value of G that because of its small error is the dominant contributor to the value that is accepted today. More recently, Fitzgerald and Armstrong (5) developed a compensated torsion balance in which electrostatic forces null out the gravitational force of the source masses, while Michaelis and co-authors (6) experimented with a compensated torsion balance using a fluid mercury bearing instead of a fiber as a support. Walesch, Meyer, Piel, and Schurr (7, 8) introduced a dual pendulum method in which the gravitational gradient of a source mass is measured through its effect on the length of a Fabry-Perot cavity supported by two pendulums at different distances from the mass. Finally, Schurr, Nolting, and Kündig (9) recently published the experimental results obtained using a beam-balance method [see (10) for discussion of these and other experiments].
The values for G determined from these experiments differ by more than 40 times the quoted standard errors. This situation--disagreements far in excess of error estimates--suggests the presence of unknown systematic problems. Other experimental techniques with a different set of systematic errors might help resolve these discrepancies.
Our method involves using a laser interferometer system to track the motion of a test mass that is repeatedly dropped in the presence of a locally induced perturbing gravity field. This field is produced by a source mass (a 500 kg tungsten torus) located alternately above and below the dropping region (Fig. 1). We conducted the experiment in a differential mode in which the acceleration of the test mass is alternately increased and then decreased by the source mass. This differential method serves to eliminate common mode errors that affect conventional gravimetry at a level about 20 times the precision we require.
Because our experiment does not require a restoring force, many of our error sources differ from those found in torsion experiments. Thus our systematic errors are largely independent of those in most other G measurements.
Conceptually this experiment is a variant of a classical orbit determination problem in which our free-falling test mass is the orbiting body (11). In effect, we are performing a satellite laser ranging experiment in the laboratory. But in contrast to classical spacecraft tracking problems in which one determines the quantity GM (G times the mass of the primary planet or star, M), we are able to extract G because we can measure M in the laboratory. This close analogy to conventional spacecraft tracking problems allows us to exploit a number of classical orbit determination techniques, including numerical quadrature of the perturbing acceleration fields, numerical integration of the Newtonian differential equations for the motion of the orbiting body, and Encke's method for dealing with a small perturbation in the presence of a large signal (12).
Experimental Method. The Measurement Apparatus. A commercially available FG-5 Absolute Gravimeter (13) was used to repeatedly drop a test mass and measure its position as a function of time [see (14-17) for details of the gravimeter]. The test mass, which contains a corner cube retroreflector, defines one arm of a Michelson-type interferometer, as in Fig. 1. The reference retroreflector is isolated from seismic noise by an active isolation system. As the test mass falls, a time mark is recorded after every 320 µm (1000 fringes). A total of 700 time/position points are recorded over the 20 cm length of each drop. These position and time measurements are directly linked to fundamental standards through the use of an iodine-stabilized helium-neon laser and a rubidium frequency standard.
The test mass falls within a cylindrical aluminum vacuum chamber customized for this G experiment to allow us to place the source mass closer to the drop (small diameter). This increases our gravitational signal. The chamber is made of aluminum (rather than the stainless steel commonly used in vacuum systems) to reduce thermal gradients. It forms an unbroken conducting shell around the drop region, thereby shielding it from electrostatic fields. A co-falling ``elevator'' shields the falling test mass from residual gas forces.
To minimize vibrations of the chamber and the reference mirror, the vacuum system was physically isolated from the rest of the gravimeter through an air/vacuum interface. The resulting effect of the vibrations on the air-vacuum interface, however, does cause slight phase errors in the interferometer output.
The interferometer reference arm is supported by an active isolation system called a ``super spring,'' a spring whose characteristic period of oscillation has been lengthened with an electronic servo loop to have an effective period of about 60 seconds, reducing the RMS acceleration amplitude of the mirror from 1000 µGal (18) (ground motion) to approximately 5 µGal in the fundamental mode. Used at a site (the Table Mountain Gravity Observatory, Colorado, operated by NOAA) that is exceptionally quiet seismically, the spring reduces the drop-to-drop scatter in observed accelerations by nearly 3 orders of magnitude. This greatly reduces the integration time required to achieve a given statistical precision.
Because many of the error sources of conventional gravimetry occur equally whether the source mass is above or below the chamber, they cancel in a difference measurement. These common mode errors, which include the effects of the air/vacuum interface, electronics, and magnetic field gradients, presently limit the accuracy of free-fall gravity instruments to 1 part in 109 of the Earth's acceleration (15, 19). Thus, because the gravimeter has much greater precision than accuracy, the small time-varying signal due to the source mass can be measured to precision far better than the large offset due to the local acceleration (virtually every G experiment exploits a differential mode).
Perturbing the Free-Fall Trajectory. The source mass is approximately ring shaped, and its axis of symmetry is coincident with the path of the test mass (Fig. 2) The axial gravitational force produced by such a ring-like shape has two extrema, resulting in two optimal positions where the integrated perturbation signal is also maximized (20, 21). Dropping the test mass through these locations not only maximizes the total signal, it also minimizes sensitivity to errors in the vertical position of the mass. Additionally, there is a minimum in the axial acceleration field as a function of radius; this minimum eases radial positioning constraints. A final benefit of the ring-design is that, at the optimal positions, errors in modeling of the masses have minimal effect.
The source mass was constructed to minimize mass density inhomogeneities. It consists of 12 tungsten alloy cylinders arranged in two levels in a toroidal shape. Cylinders can be machined to high precision and they are easy both to model and to check for mass inhomogeneities. The 12 cylinders were tested for radial density variations with an air-bearing system, for linear density variations with a pivot/balance system, and for density differences (calculated from the mass and volume of each cylinder) from one to the other. The average density of the tungsten is 17.724 g cm-3 with a standard deviation of 0.04%. The 12 cylinders were positioned to minimize the effects of the measured density variations.
A lifting assembly both supports and translates the source mass, using three lead-matched screws driven synchronously by a stepper motor/shaft-encoder system. The precise pitch of the screws allowed us to measure the position changes of the source mass.
Measuring the Perturbation. After 100 drop measurements the source mass is moved 35 cm to its alternate optimal position. This motion results in a (tiny) change in the weight of the super spring-supported reference mirror of the interferometer, because of the corresponding change in the local acceleration. This could produce an impulse to the reference mass that was synchronized with the source mass movements. However, as the motion is slower than the response of the isolation system, the equilibrium position is gently changed with little residual spring excitement. If the floor tilted synchronously with the motion of the large source mass, corresponding changes in the verticality of the gravimeter system would contaminate our data. Because the source mass translates vertically, changes in floor loading are minimal.
Figure 3 shows the measured acceleration of the test mass through an 18-hour observing session. A tidal signal is seen as ~2 cycle/day effect with an amplitude of about 100 µGal. The + 40 µGal effect caused by moving the source mass at 20-minute (100 drop) intervals is seen as a superimposed square-wave modulation.
Time-varying gravity signals are caused by a variety of mechanisms in addition to tides. Barometric pressure changes, for example, affect gravity in two ways. An increase in the mass of air above a site decreases the local acceleration. At the same time this increase compresses the ground around the site, decreasing distance to the center of the earth, and thereby causes a somewhat compensating increase in the local acceleration.
Using a superconducting relative gravimeter, we measure local gravity concurrently with the G experiment, and subtract these backgrounds to avoid noise associated with real gravity signals.
Analysis. The acceleration, a, of the test mass may be described as:
![]()
where z is the vertical position of the test mass, g is the value of local acceleration due to the earth, is the linear gradient of the local gravity field, P(z,G) is the additional acceleration of the test mass due to the source mass, and O represents signals that are not explicitly modeled, such as the common mode drag due to residual gas in the vacuum chamber. Because the forces contained within O are not systematically coupled to changes in the position of the source mass, they have little influence on our measured value of G.
The theoretical determination of the position of the test mass as a function of time involves two separate calculations. In the first computation, we found the value of the test mass acceleration due to the source mass, P(z,G). In the second, we integrated the effect of P(z,G) to complete the calculation.
In the first step P(z,G) is calculated by integrating the gravitational attraction of each differential element of the two masses over their volumes:

where the subscripts p and s refer to the test and source mass respectively, V is the volume, is the density, mp is the mass of the test mass, r is the position vector of the differential mass element, and z is the vertical component of r. Two of these six integrals were performed analytically, as described in (22, 23). The remaining four integrals were performed numerically. The algorithm was implemented twice (independently) to reduce the likelihood of software errors. Figure 4 displays the vertical acceleration of the test mass due to the perturbing force of the source mass.
The effect of P(z,G) was extracted from the data using two different algorithms. The first treats the problem as a conventional spacecraft tracking experiment [see 11, 23 for discussion]. It uses a Bulirsch-Stoer algorithm (24) to numerically integrate both the theoretical values and the partial derivatives needed for least-squares fitting of G. Sparse-matrix algorithms are used to make the enormous problem (41,510,438 total observations and 133,987 adjusted parameters) numerically tractable. The correlations between G and the other adjusted parameters were found to be small, less than 0.1.
As the correlations between G and the other adjusted parameters are small, we can use a second technique in the analysis of the data. We process the data conventionally, extracting the value of the local acceleration (as in Fig. 3). The amplitude of the 20-minute modulated signal is linear in the value of G. By theoretically calculating the constant of proportionality, we can use the observed difference to scale G. Analyzing the data in this manner is much faster than solving the large matrix (by a factor of about 200). Because the two methods agreed at a level much smaller than the estimated error, we used the faster technique in the final analysis.
Error Sources. The differential nature of the experiment cancels many errors. These include vertical alignment errors in the laser beam, frequency errors in the clock, phase errors in the system used to record fringe crossings of the interferometer, and magnetic eddy current damping errors. Drifts in these quantities (provided they are independent of the source mass position) will introduce statistically random variations in our results but not systematic offsets. Other errors that systematically affect our differential measurement fall in three broad groups: positioning errors, modeling errors, and numerical errors (Table 1). Positioning errors include errors in the relative position of the source and test mass, as well as positioning errors internal to the source mass. Modeling errors are those related to approximations made in our software system and include the precision (granularity) with which the test and source mass were modeled and integrated. Numerical errors reflect the unknown distribution of mass within the source, including possible point mass flaws and density variations (linear and quadratic along the length) in the tungsten cylinders. Secondary experiments were done to place limits on thermal signals and the airgap effect. A more complete discussion of the error sources can be found in (22).
We have explored a number of subtle systematics. One of these involves the magnetic field generated by the drive motor used to lift and drop the test mass. This motor, located below the drop region, generates a chirped magnetic signal during each drop. The conductive properties of the source mass cause it to shield the test mass from this alternating magnetic field -- but only when it is in its lower position. This could cause a differential systematic error. By empirically measuring the force of an oscillating dipole field acting on the test mass we found that this error, as well as that of simple eddy current damping of the test mass motion, are negligible.
We have explored a number of subtle systematics. One of these involves the magnetic field generated by the drive motor used to lift and drop the test mass. This motor, located below the drop region, generates a chirped magnetic signal during each drop. The conductive properties of the source mass cause it to shield the test mass from this alternating magnetic field--but only when it is in the lower position. This could cause a differential systematic error. By empirically measuring the force of an oscillating dipole filed acting on the test mass we found that this error, as well as tho of simple eddy current damping of the test mass motion, are negligible.
Other systematic errors arise from differential damping or shielding of the vibrations that accompany each drop. The sound impulse accompanying the start of the drop excites a resonance in the control feedback circuitry of the interferometer laser. The impulse of the sound wave incident on the laser is coupled to the position of the source mass---the laser is somewhat more shielded from the sound when the source mass is in only one of its positions. We were able to extract this signal from the residuals to the fit of each drop, and found that the amplitude of the frequency oscillation of the laser is modified by 50% from one position of the source mass to the other. This signal is very weakly correlated with the acceleration term of the parabolic fit, and introduces less than 5% of our error estimate.
These vibrations also affect the interferometer signal by causing the length of the air-vacuum interface between the dropping chamber and the interferometer to change. This produces phase errors in the fringe signal. The motion is differentially damped through eddy current damping. Ion pump magnets and the drive motor (which has a permanent magnetic field) are both located near the lower position of the source mass. When these magnets vibrate close to the source, they induce the damping currents within it. A bound of 75 ppm was placed on this signal by directly measuring the interface motion, and modeling its effect.
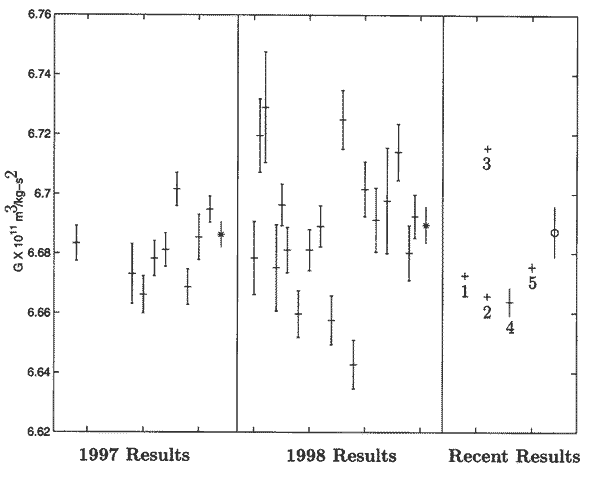
Results. Two data runs were performed, the first in May of 1997 and the second, with a slightly different system, in May of 1998. The 1997 data was processed daily, giving values of G of 6.66 x 10⁻¹¹ to 6.71 x 10⁻¹¹ m3 kg-1 sec-2. One day's observations consisted of approximately 7200 drop measurements. Outliers and data contaminated by teleseismic noise, about 5% of the data, were removed before analysis.
The external scatter of the 1997 results are 1.4 times larger than the internal scatter (evaluated from set-to-set differences). A coherent underlying signal was visible, but we believe that it was random because the scatter was normally distributed with a flat power spectrum. We suspected that some of the underlying signal might be due to changes in the laser verticality triggered by the air conditioning in the laboratory. It is possible that the air conditioning occasionally switched on and off at period of about 40 minutes, corresponding to our mass modulation rate. We include an error estimate of 440 ppm to reflect the possible bias introduced by the underlying signal. This estimate is based on testing the sensitivity of the mean value to individual days of data.
Concerns about thermal coupling motivated the 1998 experiment, which was aimed at reducing random scatter and improving the precision of our results. To this end we increased the thermal shielding of the system, and used a new fiber optic interferometer system that has improved the stability of laser verticality. We increased our frequency of modulation of the source mass, from 3/2 per hour to nearly 3 per hour, and doubled the frequency at which the test mass was dropped. We also used a super spring that we thought had better performance than the spring of the 1997 run.
As can be seen at the right side of Fig. 5, in spite of everything that was done to improve on the conditions of the 1997 experiment, our scatter in the 1998 experiment nevertheless increased by 50%, due to a corresponding increase in the set-to-set scatter of the g-values. The ratio of external to internal scatter increased to 1.9, although the distribution remained Gaussian, and the power spectrum remained flat. Fitting the data with a straight line showed that there was no significant drift in the value. Once again an underlying coherent signal was visible in the difference values. The signal modulated the G value on a time scale of a day, but was not correlated with the diurnal thermal signal. In the same manner as in the previous experiment, we assigned a bias error estimate with the underlying signal (700 ppm).
The only information indicating that there is no low frequency or DC bias in our results is the agreement between our two (different) data runs. We can use this agreement to estimate the uncertainty arising from a possible low-frequency random signal.
Our set of data (two points) is by no means a statistical ensemble, but nevertheless we use a
statistical argument to make our estimate. We associated a scatter,
![]() lf,
with an unknown random low frequency source. We can then calculate the magnitude of
lf,
with an unknown random low frequency source. We can then calculate the magnitude of
![]() lf such that the 970 ppm
difference between our two data runs would be only 37% likely (25). This analysis results
in an estimate of 1900 ppm for
lf such that the 970 ppm
difference between our two data runs would be only 37% likely (25). This analysis results
in an estimate of 1900 ppm for
![]() lf
and a corresponding estimate of 1350 ppm for the error in the mean
arising from a random low frequency signal in our data.
lf
and a corresponding estimate of 1350 ppm for the error in the mean
arising from a random low frequency signal in our data.
For the final result of the free fall experiment we combined the 1997 and 1998 data runs. The two experiments were not fully independent; the source mass was only sightly different, the same tungsten masses were arranged in roughly the same orientations. Therefore the correct combined error of the two data runs is slightly larger than the uncertainty in the mean of the combination. Adopting the uncertainty estimate for the possible low frequency random errors increases the uncertainty in the mean to a level where these distinctions are unimportant. The weighted mean result of the two free fall data runs has an uncertainty of 404 ppm. This includes only the error estimates of Table 1. Including the 1350 ppm estimate for random low frequency scatter (RSS), completes the error estimate for our experiment: (6.6873 + 0.0094) x 10-11 m3 kg-1 sec-2. The uncertainty corresponds to 1400 ppm, 0.14%. This result is shown with all the daily results and some other recent results in Fig. 5 This value for the constant lies 1.6 standard errors above the accepted CODATA value, 6.6726 x 10⁻¹¹ m3 kg-1 sec-2, and 3.0 standard errors below the. German PTB result, 6.7154 x 10⁻¹¹ m3 kg-1 sec-2.
If the random signal could be removed from our data and questions of possible low-frequency biases laid to rest, then a result at the level of 300 ppm could be achieved with the present system. Clearly our data would be close to this level if they were not contaminated. We believe that the source of the underlying drifts in our data could be found if a dedicated gravimeter were available for the purpose of researching the system.
If the underlying drifts could be eliminated, the free fall experiment would push the FG-5 close to its practical limits of precision. However, there still exist several methods of further refining the free-fall method. One idea involves modifying the system to replace the super spring reference mirror with a free-falling mirror. Such a system would form a ``gradiometer'' because it would be sensitive to the difference in the gravitational accelerations between the two mirrors rather than the absolute acceleration of either one. A gradiometer system is potentially promising because sensitivity to ground vibrations could be expected to be greatly reduced. If one had, and therefore could use, two sets of source masses, one for each dropped object, the signal amplitude could be doubled. In this mode of operation, we would measure the variation in the difference of the acceleration of the mirrors, a double difference measurement that would cancel additional errors [as in (9)].
Table 1. Error estimates for the free-fall measurement. Note that the combined error is the combined results of the 1997 and 1998 data runs. These two experiments were not completely independent, so only the statistical uncertainty was treated as independent.
| Source of uncertainty | 1997 error (ppm) | 1998 error (ppm) |
|---|---|---|
| Positioning Errors | ||
| Vertical positioning | 10 | 10 |
| Radial positioning | 85 | 60 |
| Internal positioning | 85 | 45 |
| RSS Total: | 121 | 76 |
| Modeling Errors | ||
| Granularity of mass models | 25 | 25 |
| Interpolation Density | 20 | 20 |
| Symmetry assumption | 20 | 20 |
| Modeling | 90 | 90 |
| Source mass density variations | ||
| Point mass | 60 | 60 |
| Linear | 50 | 50 |
| Quadratic | 60 | 60 |
| Angular | 25 | 25 |
| RSS total | 141 | 141 |
| Thermal Signals | 60 | 60 |
| Airgap | 75 | 75 |
| Statistical | 440 | 700 |
| Error estimate | 487 | 724 |
[ click for figures in pdf format]
Fig. 1. A schematic cross section of the experimental apparatus. The source mass was alternately
placed at the upper and lower positions at 20-minute (100 drop) intervals in the 1997 data run. In
the 1998 data run its position was switched every 11 minutes (90 drops).
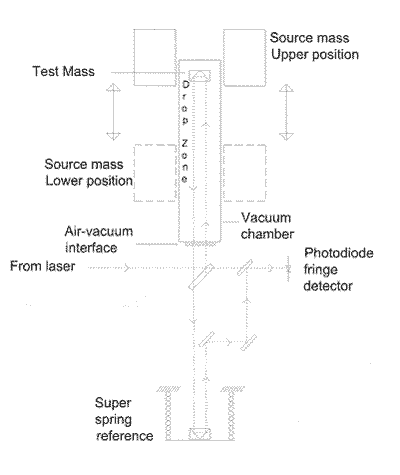
Fig. 2. A schematic cross section of the source mass assembly. Twelve large tungsten alloy
cylinders are stacked in a symmetric 6 x 2 configuration. The overall density of the source is
increased by placing smaller tungsten rods in the small inter-cylinder gaps. The source mass is
made of non-magnetic materials including tungsten and aluminum as well as small fixtures of
low-susceptibility stainless steel and bronze.
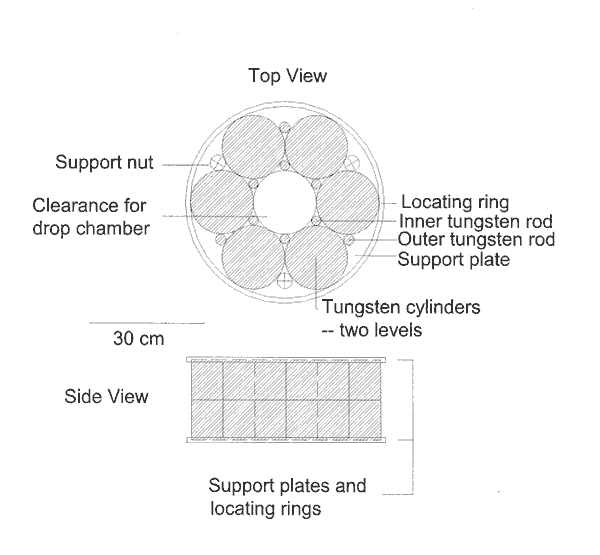
Fig. 3. A plot of 18 hours of data. The dotted line connects individual acceleration values from
54 sets of data with the large acceleration offset due to the Earth removed. Each 20 minute data
set contains 100 drops. The continuous line through the center of the data is the environmental
gravity signal (largely tidal) as recorded with a superconducting relative gravimeter.
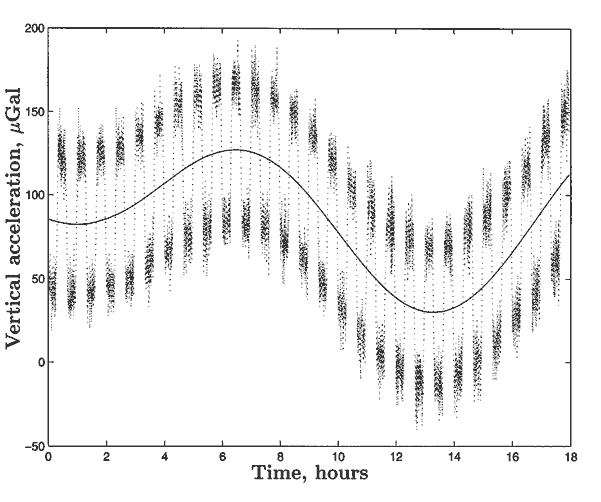
Fig. 4. Vertical acceleration of a test mass, due to the source mass, plotted against height from
the base of the source mass, for drop paths differing in their radial distance. A point mass on axis
( . . . ), 2 cm off axis (-----), and the acceleration of the actual test mass of the experiment
(_____). The lines marked by ``L'' and``U'' indicate the region of the field that the test mass falls
through when the source mass is in the lower or upper optimal position, respectively. The
arrowheads indicate the direction the test mass falls. Note that the field magnitude increases with
distance from the axis. The field is assumed to be cylindrically symmetric.
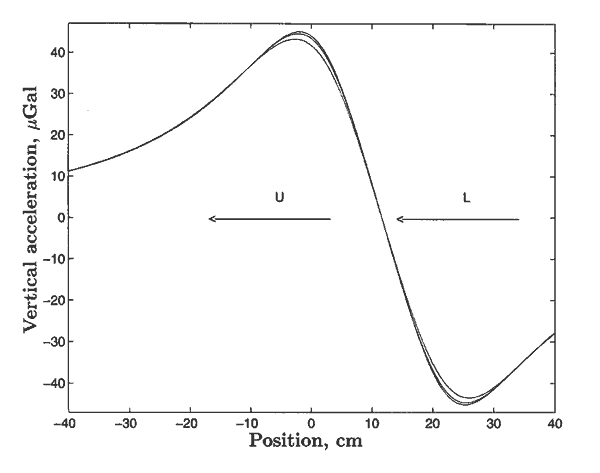
Fig. 5. A plot of G results. At the right side of the figure, recent results: 1 (4); 2 (5); 3 (6); 4 (7,
8); 5 (9). The final free-fall result is the value marked with a circle. In the middle, daily results
for the 1998 experiments. Error bars represent one formal standard deviation. The final result of
the 1997 experiment is the value with the asterisk. At the left, daily results of the 1997
experiment. The 1997 result is marked with an asterisk.
J. P. Schwarz and J. E. Faller
JILA, University of Colorado and National Institute of Standards and Technology
Boulder, CO 80309-0440
D. S. Robertson
National Geodetic Survey, NOS, NOAA, and CIRES, University of Colorado
Boulder, CO 80309-0216
T. M. Niebauer
Department of Geophysics, Colorado School of Mines
Golden, CO 80401