| April 25 2024 |
|
||
|
 |
|
Photogrammetric mapping at the National Geodetic Survey is highly developed. We have the capability to execute complete projects from start to finish. We typically acquire metric photography from a NOAA aircraft and have the aerial film processed and scanned by a private contractor. We use analytical plotters and softcopy workstations to conduct precision mapping operations. |
|
Over the past twenty years significant progress has been made in the automation of all aspects of photogrammetry. For example, the development of high performance, low cost workstations, and the advent of digital imagery have made it possible to apply signal processing techniques to the problem of locating conjugate points. This development has created a revolution in our ability to create three dimensional surface models and other derived products such as orthophotographs.
|
|
|
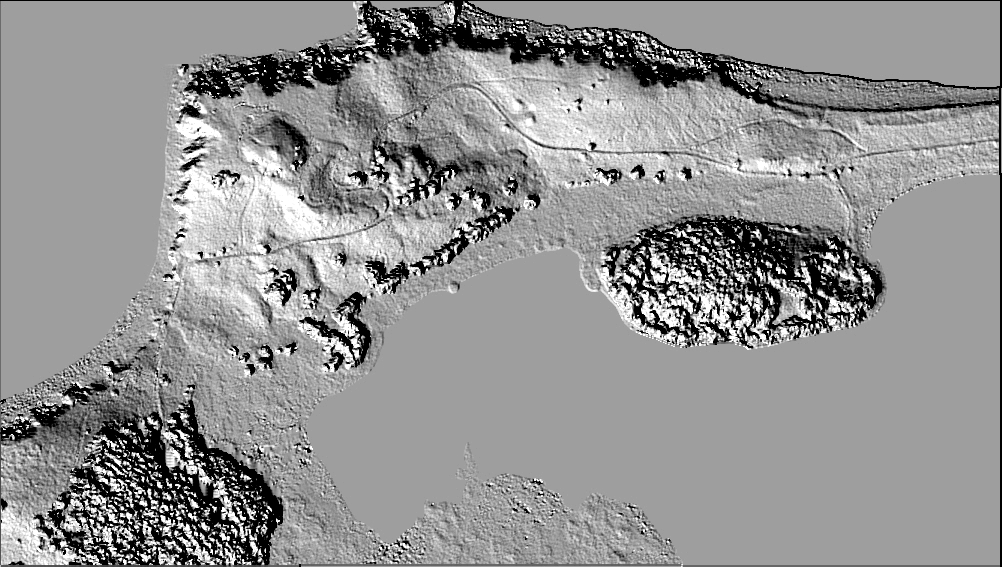
NGS is investigating methods in which to use these capabilities in the production of our shoreline manuscripts and airport obstruction charts. This image shows a 600 meter by 1000 meter digital surface model (DSM) of Cape Chiniak, Alaska, generated using digital photogrammetry. The original dataset was generated at 30 cm spacing, but the file was downsampled to produce a 1 meter product. The aerial photographs used to produce this DSM were acquired at 3,000 feet in August 1997 by the NOAA Cessna Citation II using a Wild/Leica RC-30, with 80% forward overlap. The photographs were scanned using a pixel size of 12.5 um, yielding a ground resolution of 7 cm. The DSM was generated using the Softplotter software (Vision Int.) on SGI class machines. Preliminary accuracy analysis indicates that the average error of the elevation postings was 29 cm and the maximum error was 4.2 meters. The standard deviation is 1.4 meters. The largest errors were found to be trees. This finding is not surprising given the typical conical shape of the spruce trees in the project area. On these trees, a shift in just a few cm horizontally can introduce elevation differences of a meter or more. When the 21 trees are removed from the accuracy assessment, the average error is a remarkable 1.7 cm. This result seems to indicate that the DEM does not contain an overall bias in height. The resulting standard deviation is 64 cm. Therefore, we can say that based on this limited sample of check points, that the DEM is accurate to about 60 cm at the 1 sigma level. |
See more information and a fly-through
movie on the Kodiak project.
|
National Oceanic and Atmospheric
Administration/
National Ocean Service/ National Geodetic Survey Last modified: May 16 2017 |
|