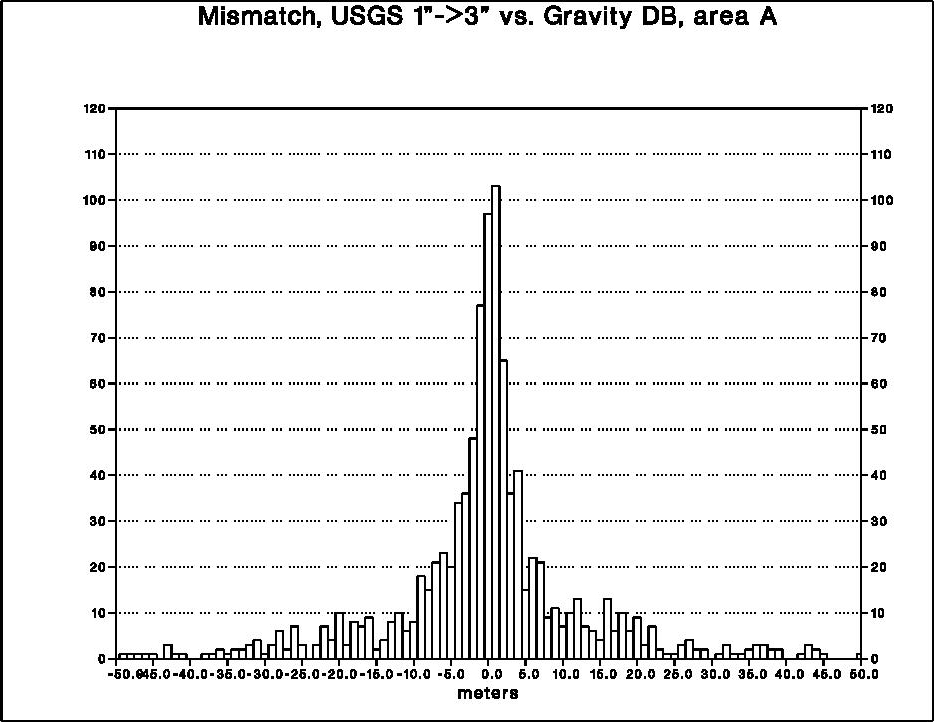
Fig. 1 Mismatch between USGS 30 meter DEM and point heights in the NGS Gravity database, Area A.
D.A. Smith, D.R. Roman NOAA/National Geodetic Survey
Abstract
For much of the past decade, high resolution geoid models have been produced at the National Geodetic Survey (NGS). The use of digital elevation models (DEMs) has been important to the computation of geoid models, but has also been one of the primary limitations of the geoid accuracy due to both poor data quality and a series of computational approximations. Recent steps have been taken at NGS to replace existing DEM data with data of finer resolution and higher quality. Additionally, new computational tools are being implemented which no longer rely on accuracy-reducing approximations. By moving toward more accurately computed terrain-induced gravity signals, errors in gravity anomalies exceeding tens of mGals have been removed, and subsequently centimeters of geoid accuracy have been gained.
1
Introduction
The need for accurate terrain data in the computation of an accurate geoid model has long been known. Whether one uses the Stokes-Helmert approach or alternative methods, such as that of Molodensky, there has always been a need for an accurate digital elevation model (DEM). Although DEMs with horizontal resolution as fine as three arcseconds have been available since the 1960’s, their general accuracy has been limited due to their data sources (small-scale digitized cartographic maps) and lack of significant photogrammetric coverage. In addition to DEM accuracy, the use of a DEM in computing geoid models is further limited by computational resources (RAM, CPU speed, disk space) and computational shortcuts (planar approximations, flat-topped prisms, constant density, Faye anomalies approximating Helmert anomalies). At NGS, even as late as 1996, the gravitational terrain signal was modelled as planar, 2-D FFT terrain corrections at a horizontal resolution of 30 arcseconds (Smith and Milbert, 1999). Initial tests at NGS indicate that significant (10 cm and greater) errors were being made in the geoid model due to the coarse resolution of the DEM, existing large-area biases in the DEM, the computational approximations in computing terrain corrections, and the use of Faye anomalies instead of Helmert anomalies. Two separate efforts were begun at NGS in 1998 to improve this situation. The first was a search for a more accurate DEM for the United States, and the second was taking some initial steps toward removing classical approximation in terrain corrections. Both were successful, and may be implemented in the GEOID99 model, anticipated for release in September 1999.
(http://www.ngs.noaa.gov/GEOID/GEOID99/geoid99.html)2
Testing New Digital Elevation Models
In the United States, there are only two significant sources of high resolution (better than 30 arcseconds) DEMs. The first is 7.5 minute quadrangle DEM from the United States Geological Survey (USGS) and the other is Digital Terrain Elevation Data (DTED) Level 1 from the National Imagery and Mapping Agency (NIMA). The comparison between the two available DEMs is made in Table 1.
It was clear from the initial comparison that the USGS data was somewhat superior to the NIMA data, but in order to be sure, two tests were conducted on these data: 1) Agreement with point heights and 2) Terrain correction tests.
Table 1.Comparison of USGS and NIMA high resolution Digital Elevation Models
Category USGS NIMA DEM Name 7.5 minute quadrangle DEM DTED Level 1 Horizontal Resolution 30 meters 3 arcseconds Grid UTM Geographic ( Availability Free on WWW Proprietary Format SDTS NIMA DTED Vertical Datum Well-defined (often NGVD 29) Unknown (named "Mean Sea Level") Horizontal Datum Well-defined (often NAD 27) Unknown (WGS72? WGS84?) Sources 1:24,000 scale maps and photogrammetry 1:250,000 scale maps and 25 other sources Biggest Problems
2.1
DEM heights versus point heights
The first test on the DEMs was to compare their gridded heights to point heights stored in the NGS database. This is important because both sources of heights are used in geoid modeling, and consistency is therefore desirable. The point heights were predominantly scaled from topographic maps by surveyors during gravity surveys. Although these heights can be erroneous, the variety of surveyors who gathered such heights supports the idea that in a large sample of point heights, errors are expected to be more or less random. Two separate 1 x 1 degree areas of the Pacific Northwest area of the USA were chosen for this test, based on the ruggedness of the topography in that region. The geographic limits of the two areas were -- Area A: 47-48° N and 237-238 ° E, Area B: 46-47° N and 240-241° E. Area A had 1076 point heights in the NGS database and Area B had 397 point heights. In each area, the gridded DEM heights were biquadratically interpolated to the location of the point heights. A difference between the heights was made, and histograms of these differences made. In order to fairly compare the USGS DEM to the NIMA DTED, the USGS DEM was decimated to 3 arcseconds first, and then height comparisons were made. Figures 1 and 2 show the histograms for Area A, and Figures 3 and 4 show them for Area B.
Fig. 1 Mismatch between USGS 30 meter DEM and point heights in the NGS Gravity
database, Area A.
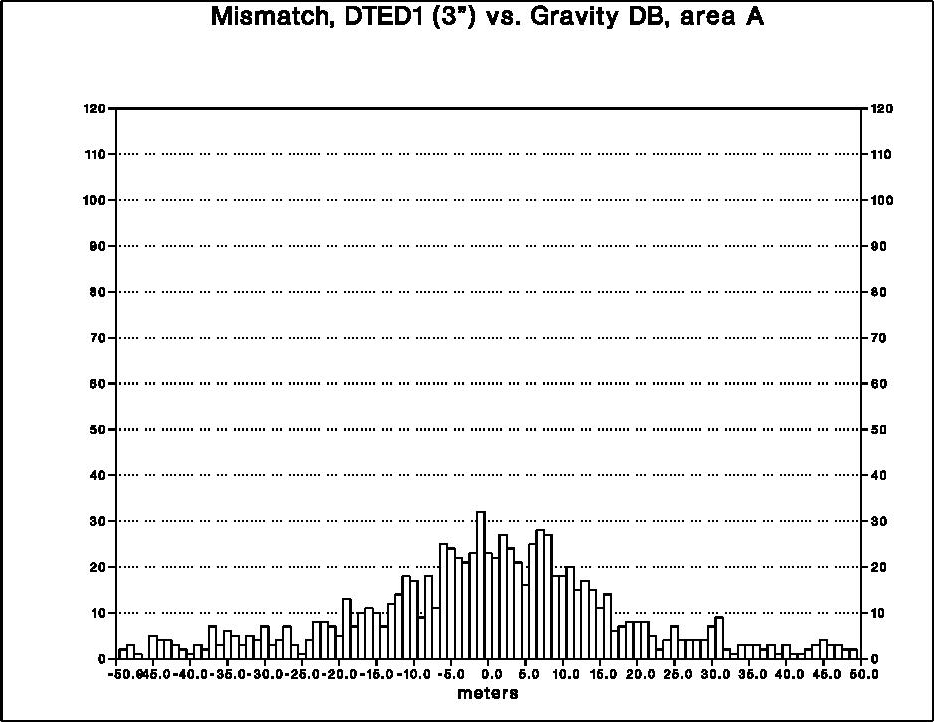
Fig. 2 Mismatch between NIMA Level 1 DTED and point heights in the NGS Gravity
database, Area A.
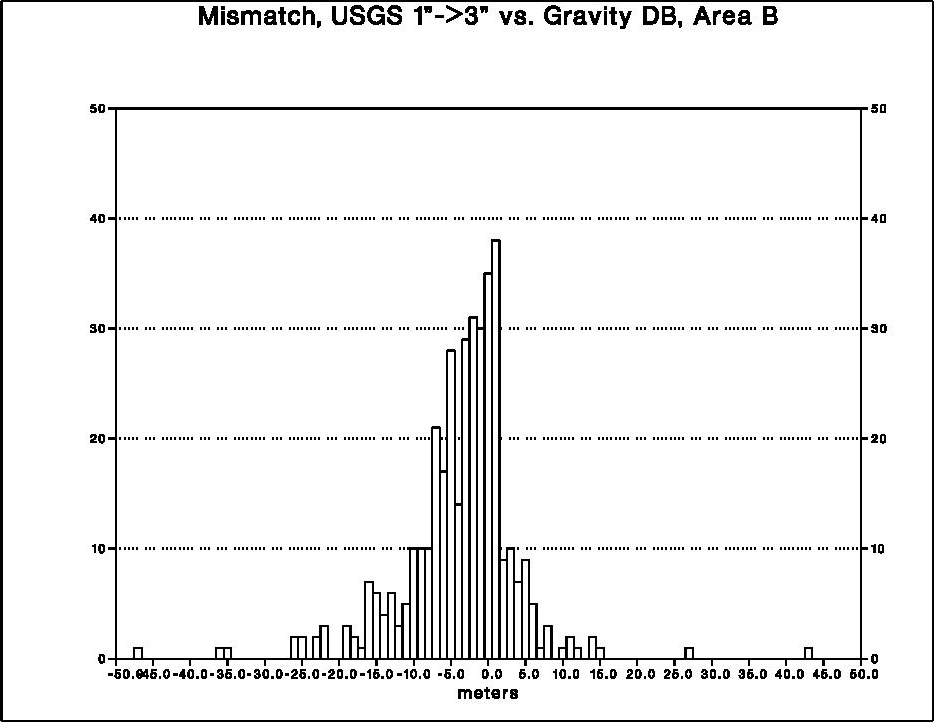
Fig. 3 Mismatch between USGS 30 meter DEM and point heights in the NGS Gravity
database, Area B.
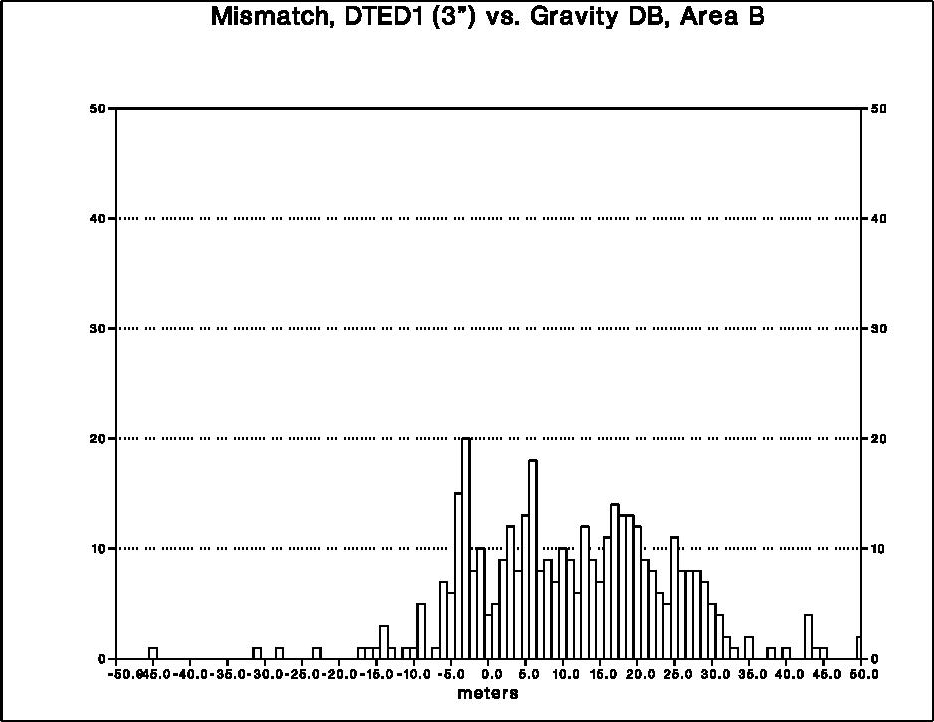
Although these figures only represent two areas, they already show a clear indication that the USGS DEM data are superior to the NIMA DTED Level 1. Note the tighter histograms of USGS (Figures 1 and 3), compared to the more spread out ones of NIMA (Figures 2 and 4). This indicates a smaller standard deviation of the differences between USGS DEM heights and the point heights, and thus better agreement in general. It is also indicative of the lack of true 3 arcsecond data contained in the NIMA DTED Level 1 data. Additionally, note in Figure 4 the large (20 meter) shift of the histogram mean from zero. This is evidence of a 20 meter bias which exists in the NIMA DTED data of this region. Discussions with NIMA personnel indicate that the source of this bias is currently unknown. In general, therefore, it is seen that the USGS data seem to have a better agreement with existing point heights than DTED Level 1.
2.2
Terrain Corrections from DEMs and their impact on the geoid
As a second test, terrain corrections (TCs) were computed from both DEMs, and compared to existing TCs based on the existing 30 arcsecond DEM, as well as compared to one another. The impacts of the various TCs on the geoid were also computed and compared. Table 2 shows the differences between various TC computations, and Table 3 shows the geoid impact of the differences seen in Table 2. In Table 3, the "Critical Distance" is the distance (in km) away from the maximum geoid impact, at which the geoid impact still exceeds 1 cm.
Table 2. Differences between various TC computations, Area A.
Category USGS minus 30" USGS minus NIMA Average 1.4 mGals 0.7 mGals Maximum 20 mGals 18mGals
Table 3. Geoid impact of differences between various TC computations, Area A.
Category USGS minus 30" USGS minus NIMA Maximum 9.4 cm 5.8 cm Critical distance 400 km 200 km
Certain conclusions can be drawn from these tables, and are further validated if one makes a detailed study of color plots (not shown in this paper) of the various data that are the foundation of these tables. First, it is clear that the larger average TCs of USGS relative to both the existing 30 arcsecond TCs as well as the NIMA Level 1 DTED TCs indicates that more "signal" or "roughness" exists in the USGS DEM. This is further evidence that the NIMA data are not completely portraying 3 arcsecond information, even though they are distributed with that horizontal resolution. Secondly, these results were over a 1 x 1 degree area, but note that geoid impacts of switching from 30 arcsecond to 3 arcsecond data can yield geoid changes up to 400 km away from the center of Area A (which is outside of Area A). Thus there is the potential for geoid changes (at the 1+ cm level) to come not only from the data inside a 1x1 degree area itself, but also from the 8 surrounding 1 x 1 degree areas, causing constructive interference at the few decimeters level.
Having conducted these comparisons, it was clear that the USGS DEM would provide the best elevation data in the USA. Since these data are on a UTM grid, were on outdated datums (NAD27 and NGVD29) and contain some blunders, it was necessary to clean and re-grid the data, and transform onto modern datums (NAD 83 and NAVD 88) before being used on a large scale at NGS. Additionally, the incomplete (85% total coverage) nature of the available data meant that some DTED Level 1 data would also need to be used. During the Spring and Summer of 1999, NGS cleaned, combined, and regridded the USGS and NIMA data (giving priority to USGS data) into a new 1 arcsecond DEM covering the Northwest quarter of the United States, called NGSDEM99 (Smith and Roman, 1999). There are plans to expand this effort in 2000 and create a 1 arcsecond DEM for the entire United States.
3
New Computational Methods
Many classical approximations in the computation of terrain-induced gravity signals are being re-evaluated at NGS for their accuracy. A few are mentioned in this paper.3.1
Spherical versus rectangular DEM prisms
When computing the gravitational attraction induced by the terrain, a planar approximation is often used. This approximation ignores the slight, but calculable, effects of the curvature of the Earth in two ways. The first, and more obvious, is the far-field spherical effect, which is the effect that the terrain dips below the horizon in a spherical co-ordinate frame, but not in planar. The second, more subtle effect, is that the shape of prisms is different in spherical versus planar co-ordinates, and this slight shape change has a noticeable impact nearest the station of interest. This is referred to as the near-field spherical effect and is illustrated in Figure 5.
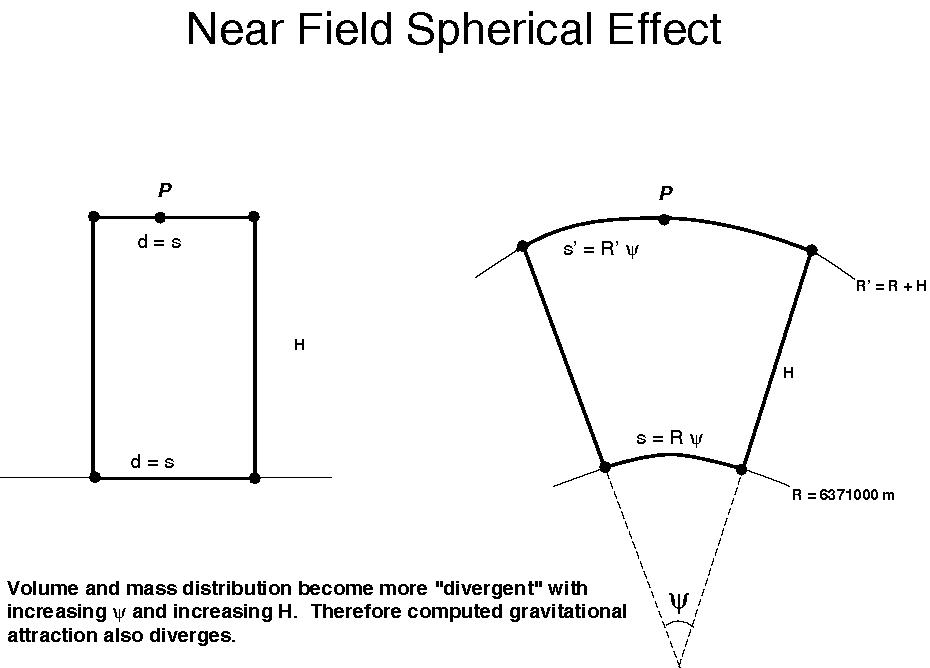
Fig. 5 Geometric illustration of the differences in near-field prisms between planar
and spherical coordinates
From the simple geometry of the near-field prisms, an empirical difference was computed between the gravitational attraction of a rectangular prism and a spherical prism. This difference can be translated as one part of the error in computing Helmert anomalies when using the planar approximation. The empirical error seems to be almost entirely based on the height, H, of the prism and not on it’s horizontal extent,
y. The empirical functionis shown in Figure 6:
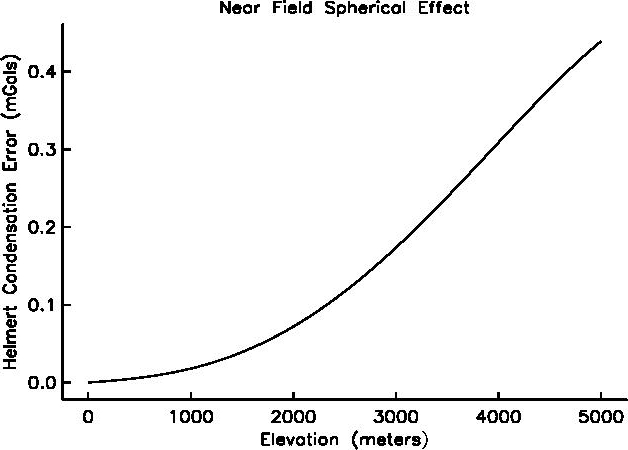
Fig. 6 Empirical error in Helmert anomaly computation due to the prism-shape error
in planar coordinates
Although the Helmert anomaly error is relatively small, the effect is systematic and should be applied to every gridded DEM location where a TC is currently computed using planar co-ordinates. If this is done, this effect has a noticeable effect on the geoid, achieving over 7 cm in the Rocky Mountains of the United States. A map of this geoid impact is shown in Figure 7:
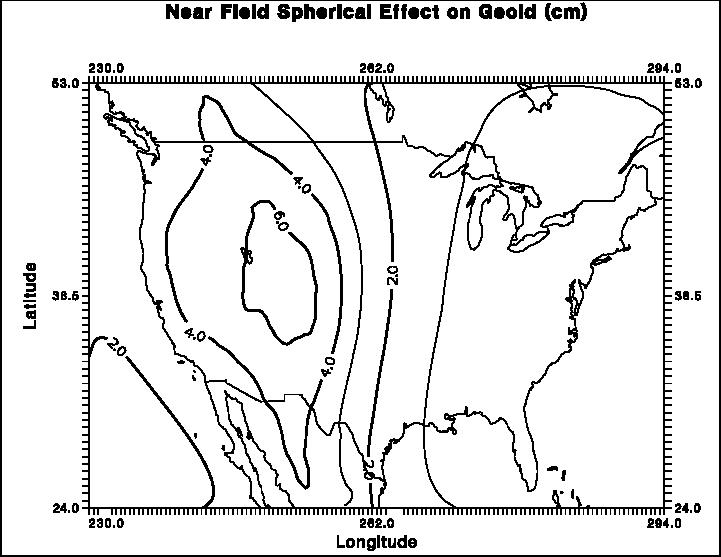
Fig. 7 Geoid impact (cm) of empirical errors in Helmert anomaly computation due to the
prism-shape error in planar coordinates
3.2
Rigorous space domain computations
Because of the regularly gridded nature of most DEMs, computations done with them (such as gravitational attraction), are naturally suited to spectral methods such as FFTs (Schwarz, Sideris and Forsberg, 1990). However, transformation of data into the spectral domain can cause inaccuracies in computations, and therefore it is necessary to have highly accurate space-domain computations as a "golden rule" against which to check all future spectral computations. With this in mind, NGS performed an accuracy analysis, computing the gravitational signal induced by the removal of local terrain, and the restoration of that terrain as a condensed layer (i.e. "Helmertization" of the terrain). In that study (Smith, Robertson and Milbert, 1999), it was found that high resolution DEM data was not necessary for large areas. In fact, a cut-off radius of 0.2 degrees was seen as acceptable in all forms of terrain for an accuracy of 0.01 mGals. Between 0.2 degrees and 4.0 degrees, high resolution DEMs may effectively be replaced with coarser DEMs (such as 30 arcseconds). Outside of 4 degrees, even coarser DEMs may be used (5 arcminutes) to compute the remaining global signal induced by topography.
4
Conclusions
The use of digital elevation models in the computation of geoid models is a long-established necessity. However, recently available DEMs, and the latest computer resources have made it possible, and worthwhile, to take steps beyond coarse DEMs with classical computational approximations. Two high-resolution DEMs, from USGS and NIMA were tested against one another, and the more accurate USGS data was used as the foundation for a new 1 arcsecond DEM (NGSDEM99) for the Northwest United States (Smith and Roman, 1999). This new DEM will be used in the next high-resolution geoid model for the United States, GEOID99 (scheduled for release September 1999;
http://www.ngs.noaa.gov/GEOID/GEOID99/geoid99.html).To supplement the new, accurate DEM data that is available, NGS has also been studying better ways of computing the terrain-induced gravity signal. Errors in old DEMs were only one reason why previous models were not of the best accuracy. The other reason has been the use of planar co-ordinates, and lack of rigorous checks on spectral computational methods. Future geoid models will make use of the latest techniques (Smith, Robertson and Milbert, 1999) to remove centimeters and even decimeters of lost accuracy in the geoid.
References
Schwarz, K.P., M.G. Sideris and R. Forsberg (1990). The use of FFT techniques in physical geodesy. Geophysical Journal International, Vol 100, pp. 485-514
Smith, D.A., D.G. Milbert (1999). The GEOID96 high resolution geoid height model for the United States, Journal of Geodesy, Vol 73, No. 5, pp 219-236.
Smith, D.A., D.S. Robertson, D.G. Milbert (1999). The gravitational attraction of local crustal masses in spherial coordinates, submitted to Journal of Geodesy.
Smith, D.A. and D.R. Roman (1999). A new high resolution DEM for the Northwest United States, submitted to Surveying and Land Information Systems.